Metal Products Production and Consumption for Ist Half-Year 2019 in Ukraine

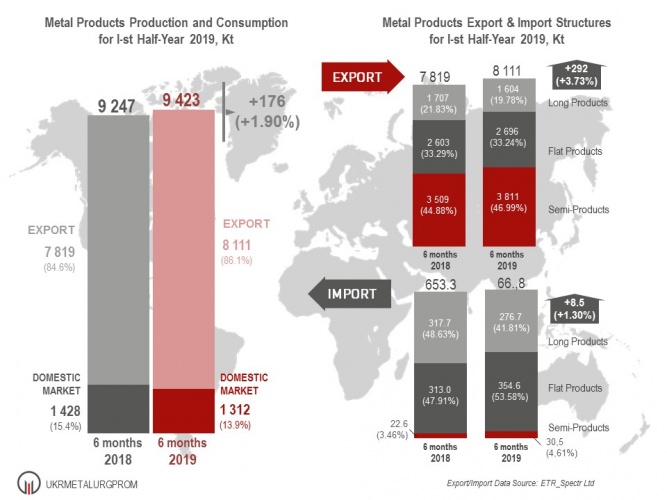
According to Association UKRMETALURGPROM, for 6 months of 2019 Ukrainian steelmakers had produced 9.42 Mt of metal products (101.9% to the same period of 2018) of which, according to ETR-Spectr Ltd, up to 8.11 Mt (or 86.1%) had been exported. For the same period of 2018 the share of export was 84.6% (7.82 Mt with the total metal products production up to 9.25 Mt).
The semi-products’ share in the total export for Ist half-year 2019 was 46.99% that is a bit higher than within Jan-June of 2018 (44.88%). The share of flat products for 6 months 2019 is almost equal to this indicator for the same period of 2018 (33.24% and 33.29% respectively); the share of long products in the total export for 6 months 2019 is lower than for the same period of 2018 (19.78% and 21.83% respectively).
The total domestic demand for metal products within 6 months 2019 was 1973.8 Kt, of which 661.8 Kt or 33.5% had been imported. For the same period of 2018 the domestic consumption was 2081.3 Kt of which 653.3 Kt or 31.4% were imported. Therefore, for 6 months 2019 the domestic demand for metal products had reduced on 5.17% comparatively to the same period of 2018, but the import component had slightly increased (+1.3%).
The peculiarity of the metal products import structure for the Ist half-year 2019 is the noticeable dominating of flat products over long products (53.58% and 41.81% respectively); within the same period of 2018 the long products share was somewhat higher than the flat products share (48.63% and 47.91% respectively).
Main markets of the Ukrainian steel products, according to ETR Spectr Ltd, for Jan-June of 2019 are EU-28 (32.1%), African countries (18.9%) and Middle East (12.2%)
Among main steel importers for 6 months 2019, the first position belongs to CIS (55.3%), second to EU-28 (18.2%), third – to Asian countries (14.8%).