Metal Products Production and Consumption in Ukraine in Jan-Aug 2024
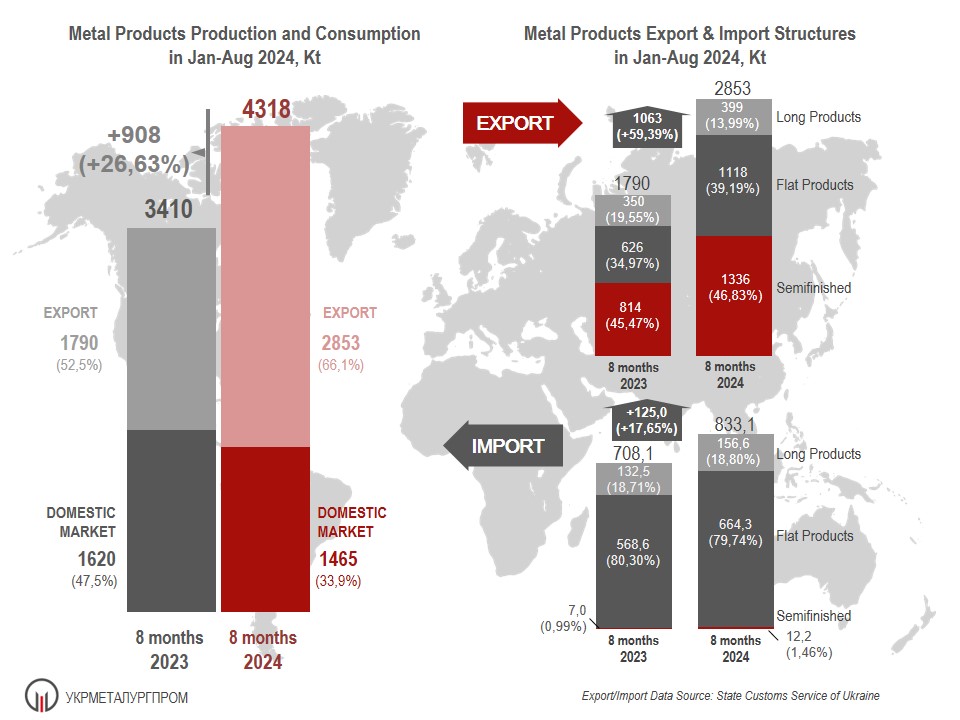
According to Association UKRMETALURGPROM, in Jan-Aug of 2024 Ukrainian steelmakers had produced 4318 Kt of metal products (126.6% to the same period of 2023), of which according to the State Customs Service of Ukraine, it was exported 2853 Kt or 66.1%. For the same period of 2023, the share of export was 52.5% (1790 Kt with the total metal products production up to 3410 Kt).
The semi-products’ share in the total export in Jan-Aug 2024 was 46.83% that is almost equal to Jan-Aug 2023 (45.47%). The share of flat products in Jan-Aug 2024 is noticeably higher to the same period of 2023 (39.19% and 34.97% respectively). The share of long products in Jan-Aug 2024 is lower significantly to the same period of 2023 (13.99% in 2024 and 19.55% in 2023).
The peculiarity of the metal products import structure in Jan-Aug 2024, as well as earlier, is a significant domination of flat products over long products (79.74% and 18.80% respectively); in Jan-Aug 2023, the domination of flat products over long products was noticeable as well (80.30% and 18.71% respectively).
The total domestic demand for metal products in Jan-Aug 2024 is 2298.1 Kt, of which 833.1 Kt or 36.25% had been imported. For the same period of 2023, the domestic consumption was 2328.1 Kt of which 708.1 Kt or 30.42% were imported. Therefore, in Jan-Aug of 2024 the domestic demand for metal products had reduced on 1.46% comparatively to the same period of 2023, and the import component share had raised on 5.84%.
Main markets for the Ukrainian steel products, according to the State Customs Service of Ukraine, in Jan-Aug 2024 are EU-27 (72.0%), Africa (9.7%) and other Europe (7.2%).
Among main steel importers in Jan-Aug 2024, the first position belongs to the other Europe (49.2%), second to EU-27 (28.5%), third – to Asia (20.6%).